Why a $500k offer today is better than a $515k offer in three months. (Let’s do the math! )
When most people think about "selling for a profit," they focus on the big number: the sale price. But there is a silent partner in every real estate transaction that quietly nibbles away at your equity every single day your home stays on the market.
These are holding costs (or carrying costs). Understanding them is the difference between a seller who "hopes" for a profit and one who actually pockets it.
What Are Holding Costs?
Holding costs are the recurring expenses you pay to keep your home running while it is listed for sale. Think of it as the "subscription fee" for owning your property. Until the keys are handed over to a new owner, you are on the hook for every cent required to maintain that asset.
The Common Culprits
-
Mortgage Interest: Not the full payment, but the interest portion that doesn't build equity.
-
Property Taxes: These are typically prorated at closing, so every extra day on market increases your bill.
-
Homeowners Insurance: Essential for protection, but a daily drain on proceeds.
-
Utilities: Even if the house is vacant, you must keep the HVAC running to prevent mold/pipe bursts and the lights on for showings.
-
Maintenance: Lawn care, pool cleaning, and snow removal don't stop just because you're moving.
-
HOA Dues: These are non-negotiable and often billed monthly or quarterly.
The "Stale Listing" Trap: How Time Erases Net Income
Holding costs have a compounding effect on your net income. It isn't just the $2,000–$4,000 a month in bills; it’s the price erosion that happens to "stale" listings.
Studies show that homes sold within the first 30 days typically sell for 99% of their list price. By day 120, that average drops to roughly 91.5%.
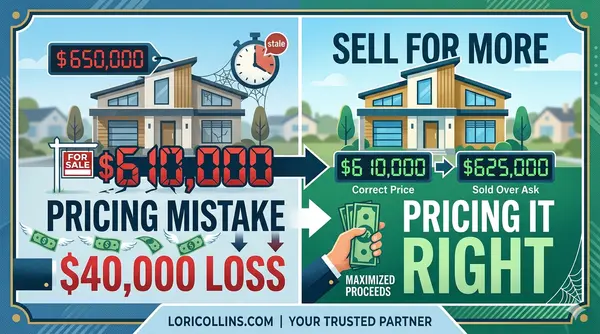
The Math in Action: > Imagine a $500,000 home with $3,000 in monthly holding costs.
Scenario A: Sells in 30 days at full price. Net after 1 month of costs: $497,000.
Scenario B: Sells in 4 months after a 5% price cut to attract a buyer.
New Sale Price: $475,000
4 Months of Holding Costs: $12,000
Total Net: $463,000
In Scenario B, the seller lost $34,000 in net equity by trying to "wait for the right buyer."
How to Estimate Your Daily Holding Cost
To make an informed decision on your list price, you need to know your "burn rate." Follow this simple 3-step calculation:
1. The Monthly Tally
Add up your monthly interest (look at your mortgage statement), property taxes (annual ÷ 12), insurance (annual ÷ 12), average utilities, HOA fees, and basic yard maintenance.
2. The Daily Rate
Divide that total by 30. If your monthly costs are $3,600, your home costs you $120 every single day.
3. The Opportunity Cost
While harder to track, remember that your equity is "trapped." If you have $200,000 in equity that could be earning 5% in a high-yield account, you are effectively "losing" another $833 per month while it sits in the house.
Using Holding Costs to Set Your List Price
Now that you know your daily burn rate, you can use it to determine a strategic list price.
The "Aversion to Risk" Strategy
If your holding costs are exceptionally high (e.g., you’ve already moved and are paying two mortgages), it is often more profitable to price your home 2–3% below market value.
-
Goal: Spark a bidding war in the first 7 days.
-
Result: You trade a tiny bit of potential sale price for a guaranteed fast closing, potentially saving 3–6 months of holding costs.
The "Testing the Market" Danger
Many sellers want to "test the market" with a high price, thinking they can always lower it later. However, if your daily holding cost is $150, a 60-day "test" costs you $9,000 in cash. If you eventually have to drop your price by $10,000 to get an offer, your total loss is $19,000.
Summary: Focus on the Net, Not the Gross
When your agent brings you a Comparative Market Analysis (CMA), don't just look at what the neighbors' homes sold for. Look at their Days on Market (DOM).
A high list price is a vanity metric. Your Net Proceeds—the check you walk away with at closing—is the only number that matters. By factoring in holding costs, you can price your home to move quickly, protect your equity, and move on to your next chapter with more money in your pocket.
To help you see the "burn rate" of your home in real-time, I’ve designed a template you can easily copy into Excel or Google Sheets. This will give you a clear view of your daily, monthly, and projected total costs.
Home Seller’s "Holding Cost" Tracker
| Category | Item | Monthly Amount ($) | Daily Cost ($) |
| Finance | Mortgage Interest (Only) | $1,800.00 | $60.00 |
| Taxes/Insurance | Property Taxes (Annual ÷ 12) | $450.00 | $15.00 |
| Homeowners Insurance | $120.00 | $4.00 | |
| Utilities | Electricity & Gas | $210.00 | $7.00 |
| Water / Sewer / Trash | $90.00 | $3.00 | |
| Maintenance | HOA Dues | $150.00 | $5.00 |
| Yard Care / Pool Service | $180.00 | $6.00 | |
| TOTALS | Your Monthly "Burn" | $3,000.00 | $100.00 |
The "Price of Waiting" Calculator
Use this simple table to see how much your net profit shrinks the longer the house sits.
| Days on Market | Accumulated Holding Costs | Potential Net Loss |
| 30 Days | $3,000 | $0 (The baseline) |
| 60 Days | $6,000 | -$3,000 |
| 90 Days | $9,000 | -$6,000 |
| 120 Days | $12,000 | -$9,000 |
How to set up the formulas in your sheet:
-
Daily Cost Column: Set the formula to
=Monthly Amount / 30. -
Monthly Total: Use
=SUM(C2:C8)to add up all your expenses. -
The "Wake Up Call": Create a cell that calculates:
Daily Cost * [Estimated Days to Close] = Total Impact on Net Income
Pro-Tip for Accuracy
When calculating your Mortgage Interest, don't just use your total monthly payment. Look at your latest mortgage statement or amortization schedule. Your principal payment is technically forced savings (equity), so it doesn't "cost" you anything. Only the interest is a true lost expense.
Categories
Recent Posts